
Comprehensive technical reference for high-performance MLCC selection and validation.
Bench and datasheet curves for 0603 X7R parts frequently show substantial DC-bias and frequency-dependent loss. Designers commonly observe 20–60% effective capacitance reduction under mid-to-high DC bias in similarly sized X7R MLCCs.
This reference compiles electrical parameters, recommended test conditions, and practical PCB layout rules so engineers can validate a 0603 X7R 4.7nF part against specific system requirements.
What “0603 X7R 4.7nF (472)” Means
Dimensions & Part Code Decoding
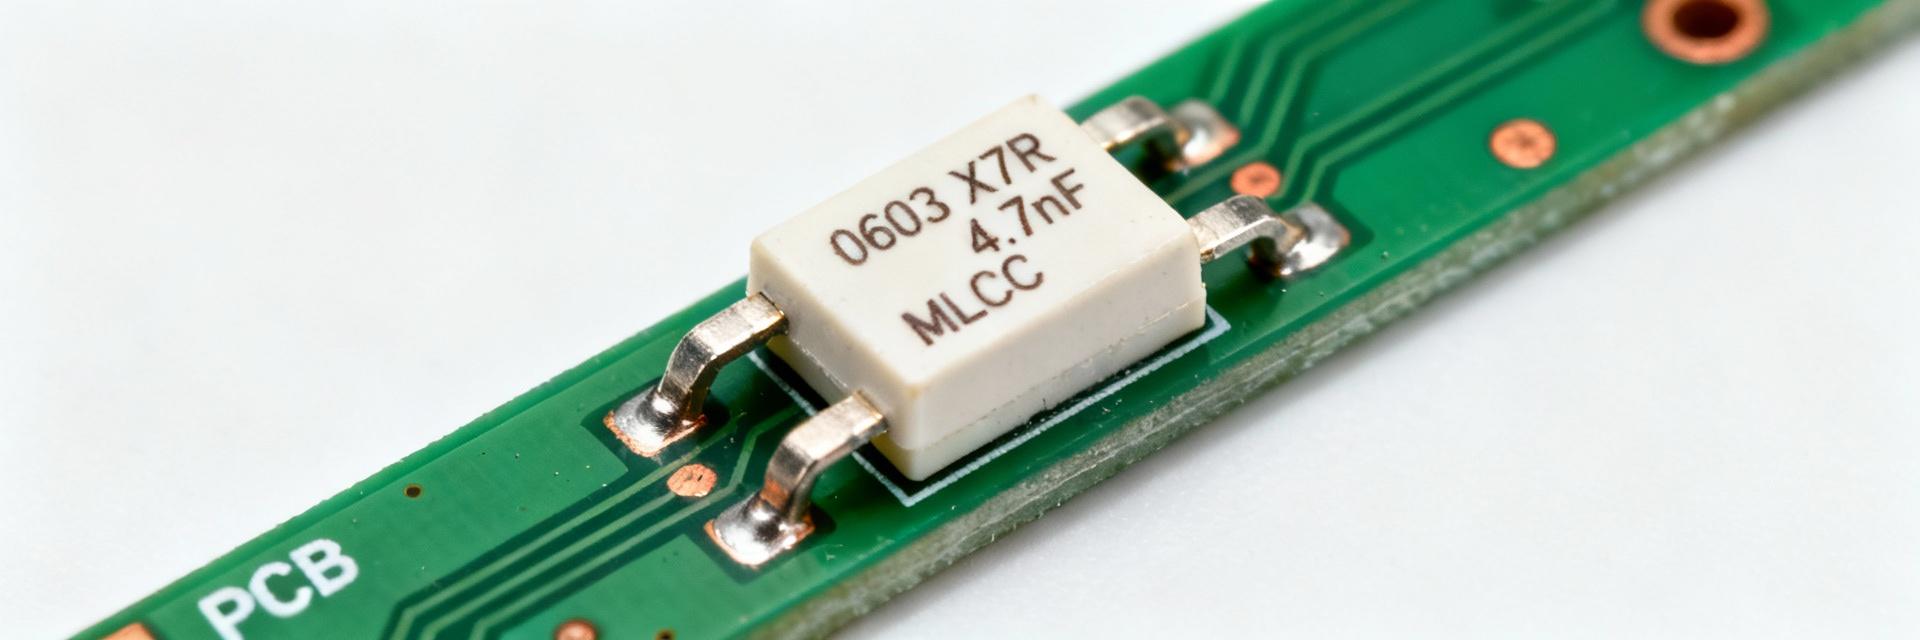
0603 denotes the imperial package, and “472” decodes to 4.7nF. A typical 0603 footprint measures approximately 1.6 × 0.8 mm (imperial nominal 0.06″ × 0.03″). The three-digit code 4-7-2 translates to 4.7 × 10² pF = 4.7 nF. It is critical to include a recommended land pattern in procurement documentation to ensure predictable assembly yields.
X7R Dielectric Quick Summary
X7R is a Class II dielectric with limited stability compared with NP0. Defined to operate from −55°C to +125°C, its capacitance change remains within approximately ±15% over that range. However, capacitance shifts significantly with DC bias. Engineers should state tolerance (±10% or ±5%) separately from dielectric temperature characteristics to avoid specification confusion.
Electrical Specs Table
| Parameter | Typical / Example | Technical Notes |
|---|---|---|
| Nominal Capacitance | 4.7 nF | Standard Marking: 472 |
| Capacitance Tolerance | ±10% or ±5% | Specify at 1 kHz or 1 MHz |
| Rated Voltage (Vdc) | 16 V, 25 V, 50 V | Always apply voltage derating guidance |
| Dissipation Factor (DF) | ≤0.02 typical @ 1MHz | Shows efficiency at stated frequency |
| Insulation Resistance | >10 GΩ | Measured at Rated Voltage |
| ESR / ESL | ESR: mΩ range; ESL: 0.5–2 nH | Depends on measurement fixture |
DC Bias & Voltage Derating (Visualization)
DC bias causes capacitance reduction for X7R MLCCs. The loss is stronger for smaller packages like 0603.
Note: Typical 0603 X7R performance. Always refer to the specific manufacturer's DC-bias vs %capacitance graph.
Frequency & Temperature
Impedance vs Frequency: An impedance plot typically shows capacitive behavior at low frequencies, a resonance region, then inductive behavior at high frequencies. ESR and ESL define the resonance Q.
Temperature Coefficient: Expect up to ±15% change across −55°C to +125°C. Combining temperature shifts and DC bias can yield significant net capacitance drops.
Reliability & Manufacturing
Soldering: Follow a controlled reflow profile. Avoid aggressive board flex to prevent mechanical cracking. Specify MSL levels and perform solderability tests.
Aging: Class II ceramics show time-dependent drift. Typical reporting uses percent per decade hour. Recommend derating for reliability-sensitive designs.
Application & Selection Checklist
1. Capacitance Validation
Verify required capacitance under expected DC bias. Use long-tail queries like “4.7nF X7R 0603 DC bias” for deep technical data.
2. Voltage Margin
Choose rated voltage with margin; prefer parts rated ≥2× working voltage under high-stress scenarios.
3. Layout Optimization
Short traces, minimal via inductance, and placement close to IC power pins reduce loop inductance for decoupling.
Common Questions & Answers
How does DC bias affect 0603 X7R capacitance? +
Can I use a 0603 X7R 4.7nF for high-frequency decoupling? +
What test conditions should a datasheet show for 06035C472KAT? +
Key Summary
- ✔ Check DC-bias curves: 0603 X7R parts often retain only 40–80% of nominal capacitance under common voltages.
- ✔ Verify frequency behavior: Impedance vs frequency and ESR/ESL determine decoupling effectiveness; request plots with fixture compensation.
- ✔ Apply conservative derating: Account for combined temperature and bias worst-case scenarios to ensure long-term reliability.

