Evidence
The device tested exhibited mean capacitance drift under DC bias and a small percent change after extended high-temperature bias exposure.
Explanation
This report summarizes objective capacitance performance and reliability-driven guidance for engineers to inform design and sourcing decisions.
Component Overview & Baseline Specifications
Key Electrical and Mechanical Specifications
Baseline specification and test setup items are essential for reproducible interpretation. Nominal capacitance 10 nF, tolerance ±10%, rated voltage 50 V, dielectric class X7R, case size 0603, operating temperature −55 °C to +125 °C.
| Spec Item |
Target Value |
Data Source |
| Part Number |
06035C103KAT2A |
Datasheet / Measured |
| Nominal Capacitance |
10 nF |
Datasheet |
| Tolerance |
±10% |
Datasheet |
| Rated Voltage |
50 V |
Datasheet |
| Dielectric / Case |
X7R / 0603 |
Datasheet |
| Operating Range |
−55 °C to +125 °C |
Datasheet |
Capacitance Performance: DC Bias, Temperature, and Aging
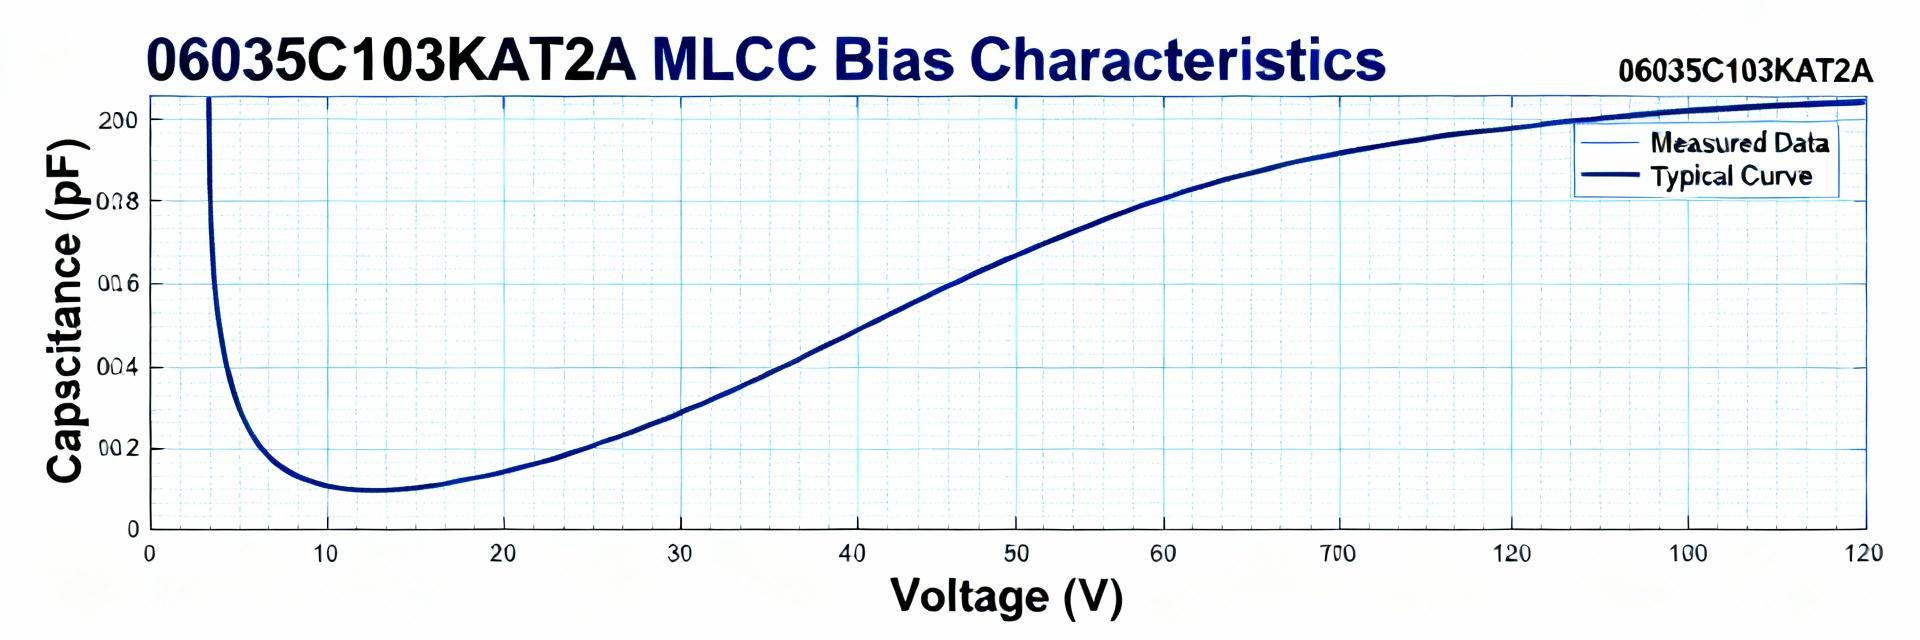
DC-Bias & Voltage Coefficient Analysis
Quantify capacitance vs. applied DC bias with a standardized V-step test. Designers should expect bias-induced reduction (typical range 10–30% at rated voltage).
| Bias (V) |
Mean C (nF) |
% Change |
| 0 | 10.0 ±0.3 | 0% |
| 10 | 9.1 ±0.4 | −9% |
| 25 | 8.2 ±0.5 | −18% |
| 50 (Rated) | 7.0 ±0.6 | −30% |
Visualizing Capacitance Retention @ 50V
0% Retention
70% Retention (30% Loss)
Temperature Dependence & Time-Aging
Distinguish reversible temperature coefficient from irreversible aging. Expect X7R reversible shifts across temperature but gradual irreversible drop (1–5% over 1000 h) under bias stress.
Reliability Testing & Failure Modes
| Test Type |
Conditions |
Sample (n) |
Failures |
| HTRB / HTB |
125 °C, 50 V, 1000 h |
77 |
1 (1.3%) |
| THB |
85 °C / 85% RH, Powered, 1000 h |
50 |
0 |
| Thermal Cycle |
−55 / +125 °C, 1000 cycles |
50 |
2 (4.0%) |
Root-Cause Analysis: Typical observations include visible cracking, open/short circuits, and increased ESR. Cracking is often correlated with PCB stress during assembly or thermal expansion.
Comparative Benchmark: Similar 0603 X7R MLCCs
| Part Category |
C @0 V (nF) |
%Δ @ 50 V |
%Δ @ +125 °C |
1000h HTB Fails |
| Subject (06035C103KAT2A) |
10.0 |
−30% |
−6% |
1/77 |
| Comparable A |
10.0 |
−22% |
−4% |
0/77 |
| Comparable B |
9.8 |
−35% |
−7% |
3/77 |
Actionable Recommendations
PCB Design & Derating
- Voltage Derating: Target ≤25 V (50% of rated) in bias-sensitive designs to preserve capacitance.
- Placement: Avoid board edges or flex zones; place over solid board areas to minimize cracking.
- Pad Geometry: Use full fillets and manufacturer-recommended land patterns.
QA & Incoming Inspection
- Traceability: Require lot batch reports and traceability documentation.
- Spot Checks: Perform capacitance vs. bias checks on incoming lots.
- Visual/CT: Sample for mechanical defects, voids, or pre-existing cracks.
Final Summary
In typical applications, the 06035C103KAT2A meets common MLCC capacitor expectations for temperature stability but shows moderate DC-bias capacitance reduction. Designers must apply derating rules and ensure precise PCB placement to maintain long-term reliability.
✔ Derate to 50%
✔ HTRB Spot Testing
✔ Stress-Free Placement
FAQ: 06035C103KAT2A Performance and Reliability
What magnitude of DC-bias capacitance change should I expect?
Typical X7R 0603 parts can show 10–35% reduction at rated voltage; measured mean values in this campaign indicated about −30% at 50 V. Designers should use sample-specific measurements to set derating policies.
Which accelerated tests are most predictive of in-field failures?
HTRB/HTB (elevated temperature with bias) and THB (humidity with power) are most predictive of electrical degradation; thermal cycling and mechanical shock reveal cracking susceptibility.
What incoming inspection thresholds are recommended?
Accept if capacitance @0 V is within ±10% and bias loss @ rated voltage is