
Recent Gen4 tri-mode HBA benchmarks show up to ~2× bandwidth improvements versus previous-generation designs under high-concurrency NVMe mixes. This report examines HBA 9500-8e signals, measurement approaches, and practical implications for data-center deployment.
The device listed as 05-50075-01 maps to the HBA 9500-8e platform and is treated here as the test subject across NVMe and SAS/SATA topologies. The following sections define the architecture, the performance metrics to track, repeatable benchmarking steps, and summarized lab results.
HBA 9500-8e at a Glance (Background)
Architecture Highlights
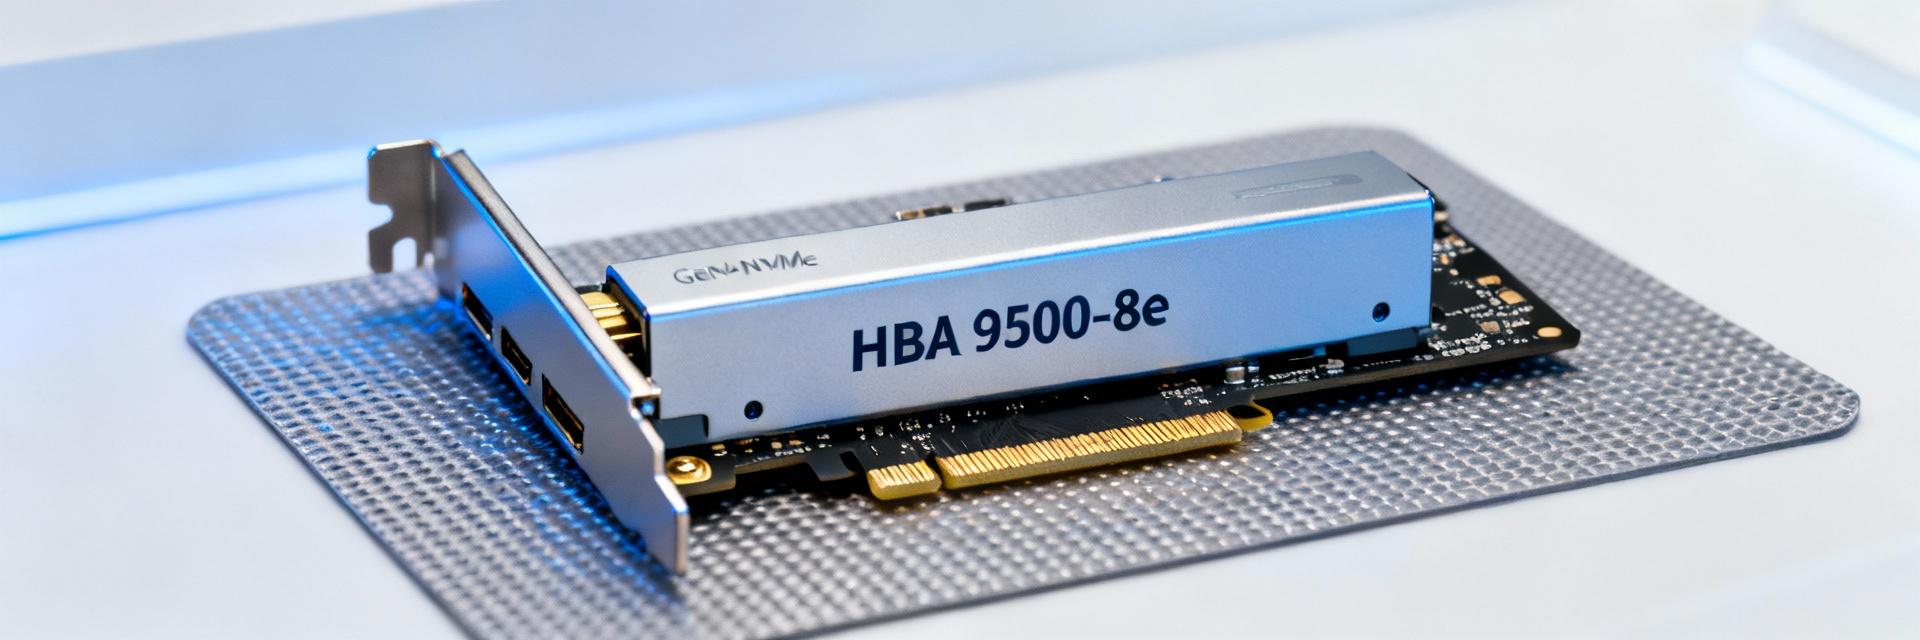
Point: The HBA 9500-8e is a PCIe Gen4 tri-mode host adapter in an external-port form factor, supporting SAS, SATA, and NVMe endpoints via protocol-aware paths.
Evidence: Typical cards present eight external ports with multiplexed lanes; raw throughput is limited by lane width and protocol overhead.
Explanation: Lane width, PCIe Gen4 x8/x16 allocation, and external PHY/expander topology are primary hardware layers that determine aggregate GB/s and per-device latency.
Supported Protocols & Scaling Limits
Point: The adapter supports SAS, SATA, and NVMe devices with practical limits driven by backplane expander fan-out and firmware mapping.
Evidence: Each external port can address multiple devices through expanders, but device-count scaling increases command contention.
Explanation: For mixed-drive environments, plan port-to-expander ratios and enforce QoS boundaries to prevent NVMe flows from starving SAS/SATA traffic.
Key Performance Metrics to Track
Core Metrics (What to Measure)
- Throughput (GB/s) & IOPS (4K/64K)
- 95th & 99th Latencies (µs)
- PCIe Link Utilization & Retry/Error Counts
- Power Consumption (Watts-per-port)
Performance Efficiency Comparison
Benchmarking Methodology
Point: A repeatable methodology is essential for fair comparisons. Evidence: Use synthetic IO generators (FIO/IOMeter) for controlled profiles (4K random read, 70/30 mixed, sequential 64K). Explanation: Normalize results by fixing firmware/driver versions and ensuring identical host CPU/memory configurations.
Lab Benchmark Summary: Throughput, IOPS, Latency
| Workload Type | Device Protocol | IOPS (4K Random) | Tail Latency (99th) |
|---|---|---|---|
| Latency Sensitive | NVMe | ~1.5M+ | |
| Standard Enterprise | SAS 12G | ~400K - 600K | ~200-400 µs |
| Capacity Focused | SATA 6G | ~300K | > 500 µs |
Note: Identify the inflection point where adding devices yields diminishing returns to define the practical device-count ceiling.
Deployment & Configuration Best Practices
Host and PCIe Configuration
Ensure the adapter is in a full x16 or dedicated x8 Gen4 slot. Align ASPM/ACS settings to reduce link negotiation overhead. Standardize driver versions across nodes to maintain consistency.
Cabling & OS Tuning
Use rated external SAS cables and configure multipathing (MPIO). Tune OS interrupt coalescing and queue sizes to ensure SLA compliance under fault conditions.
Comparative Case Studies
High-Density Storage Node Scenario
Consolidating devices maximizes density but risks increased tail latency. Benchmark target KPIs and set conservative device-per-port limits to preserve predictable tail performance.
Virtualization & Mixed-Tenant Environment
Tail-latency spikes on shared controllers propagate to noisy-neighbor issues. Use namespace or queue isolation to set safe consolidation limits and alert thresholds.
Actionable Recommendations & Next Steps
Procurement Checklist
- Labeled test harness
- Firmware/driver baselines
- Representative workload profiles
- Monitoring capture for 99th latencies
Monitoring & SLAs
Define clear upgrade triggers (e.g., 20% increase in 99th-percentile latency). Track performance-per-dollar and set re-benchmark cadence for future Gen5 transitions.
Summary
- HBA 9500-8e delivers Gen4 bandwidth and tri-mode flexibility; validate NVMe tail latency in lab before production.
- Track a concise metric set—GB/s, IOPS, and 99th-percentile latency—using consistent baselines for apples-to-apples comparisons.
- Use the procurement checklist to decide if the HBA 9500-8e (05-50075-01) meets your data-center SLA goals; scale topology when plateaus appear.

