
Background: Part Overview and Reliability Context
Part Spec Snapshot
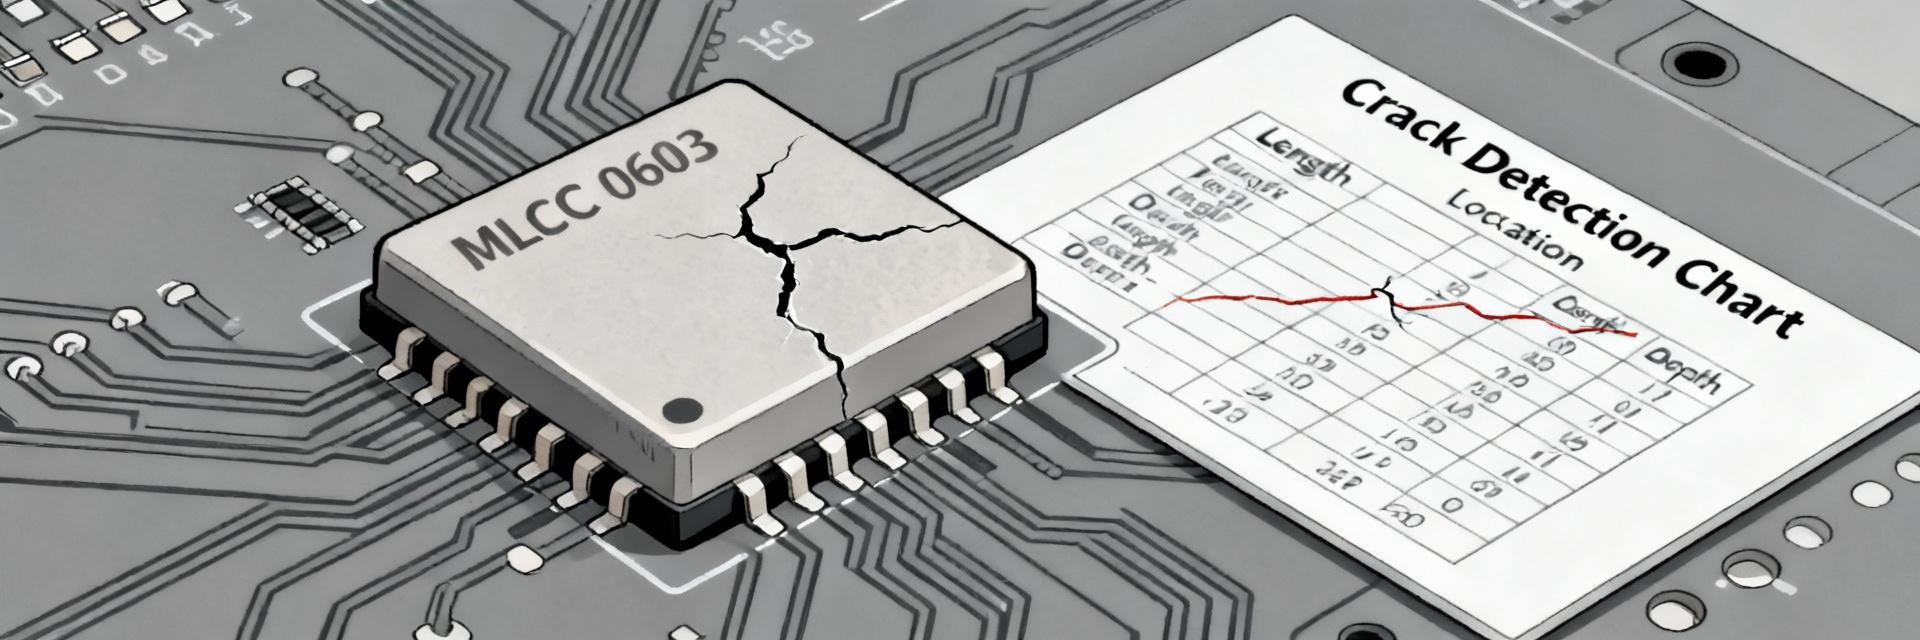
The part is a 10 nF, X7R dielectric multilayer ceramic capacitor in 0603 (1608 metric) packaging rated to 50 V with ±10% tolerance. Capacitance, tolerance, dielectric class, and package size set susceptibility to C-V drift, DC-bias loss, and mechanical cracking under board flex.
Typical Applications and Stress Drivers
Uses include power decoupling, rail filtering, and timing circuits. Field return patterns show most failures originate in high-power decoupling locations. DC bias, thermal cycling, and board flex during assembly are primary stressors; designers should expect these scenarios to expose the weakest failure modes.
Test Methodology & Lab Setup
Sample Selection
The tested population was randomized across 8 manufacturing lots (N≈150 per lot). Binomial 95% confidence intervals were computed for pass/fail proportions. This reduces sampling bias and supports defensible failure-rate estimates.
Test Conditions
The lab matrix included biased humidity, high-temp storage, thermal cycling, mechanical bend, and DC-bias characterization. Each test recorded temperature, RH, bias voltage, and cycle counts.
Aggregate Test Results & Failure Rates
Aggregate pass/fail tallies show failures concentrated in mechanical bend and biased-humidity tests. Raw failure rates fluctuated between 0.8% and 2.8% depending on the specific lot.
Visual Failure Rate Analysis (%)
| Test Type | Units | Failures | Fail Rate | 95% CI |
|---|---|---|---|---|
| Biased Humidity | 800 | 16 | 2.0% | 1.1–3.2% |
| Thermal Cycling | 800 | 6 | 0.75% | 0.28–1.6% |
| Mechanical Bend | 600 | 12 | 2.0% | 1.0–3.4% |
Reliability Metrics: Weibull analysis (beta
Failure-Mode Analysis: Technical Breakdown
✓ Design and Reliability Recommendations
PCB & Layout Strategies
- Use larger pads and thermal relief to reduce stress concentrations.
- Implement voltage derating (use lower voltage rating than max).
- Maintain a 20–30% capacitance margin.
Assembly Best Practices
- Limit board flex during assembly and handling.
- Use conservative reflow ramps to prevent thermal shock.
- Conduct incoming baking for moisture-sensitive lots.
Practical QA & Purchasing Checklist
Incoming Inspection
Include visual inspection, spot capacitance/ESR checks, and lot/date-code verification. A 2–4% sampling protocol with binomial acceptance criteria captures most anomalous lots before they reach the assembly line.
Field Monitoring
Telemetry should record time-to-failure, operating voltage, and ambient conditions. Linking board position to failure mode shortens analysis cycles and informs future BOM cycles.

